Plotting Your First Functions
The Story So Far
Pretend you are teaching a differential equations class, and you have reached the classic Vibrating Strings Problem.
To make the class come alive, you want to show them strings that vibrate. Unfortunately, strings - at the sizes available to you - vibrate far too quickly for your phone to pick up well, and someone is already using the long string that the physics department lends out for this purpose.
What you are going to do is show them the solutions using Python.
The Higher Mathematics
Don't worry, I'm not going to make you solve a differential equation (at least, not until SymPy - and then you'll have some help). This is a great problem to wow your students because - with a stationary start - it has a linear solution.
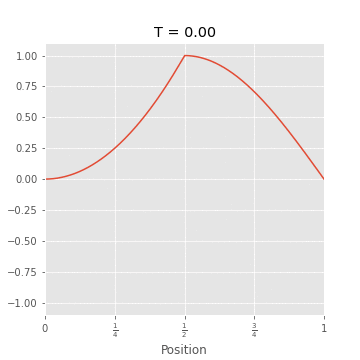
Theorem: Suppose the initial position of a "string" on the interval $[0,1]$ is given by $f(x)$, with fixed ends $f(0) = 0$ and $f(1)=0$. The initial velocity of the string is uniformly 0.
Define the "odd periodic extension" $h(x)$: \[ h(x) := \begin{cases} f(x) & 0 \leq x \leq 1 \\ -f(2-x) & 1<x\leq 2 \\ h(x \mod 2) & \text{else} \end{cases} \]
Then the position of the string at time t is given by $\dfrac{h(x+t)+h(x-t)}2$
The Goal
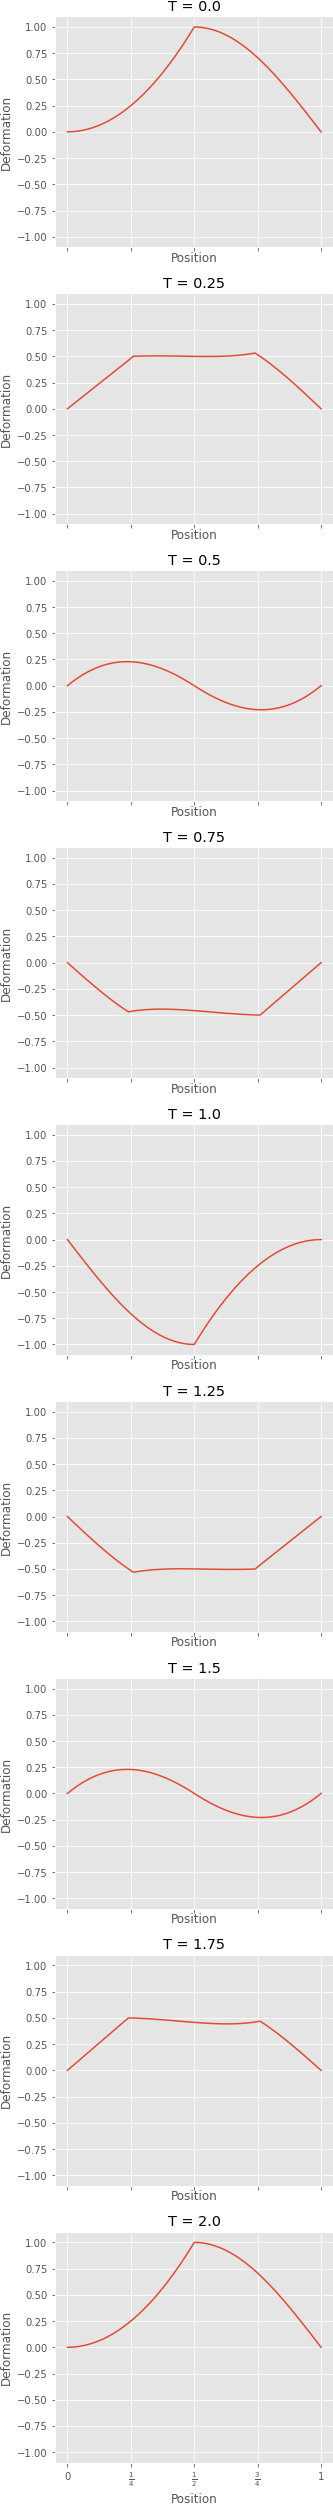
Graded Assignment: Write (and document) a function vibrating_string_snapshots which:
- Takes parameters:
- $f$ a function which defines the starting condition (for example,
def f(x): return math.sin(x*math.pi)) - $n$ a positive number of graphs to generate, evenly spaced, on the time interval $[0,2]$. Default to 9.
- A width for each graph in inches, default 5.
- a height for each graph; default to the width.
- $f$ a function which defines the starting condition (for example,
- Returns a matplotlib figure containing:
- $n$ plots of the vibrating string solution, one graph per plot, evenly spaced on the closed time interval $[0,2]$.
- In ggplot style
- Vertically stacked.
- With matching $x$ and $y$ axes for each plot.
- With $x$ axis ticks and labels at the quarter values.
- With the $x$ and $y$ axes labeled.
- Each plot should include both end points.
Don't try to do too much at once - start with a single example, such as sin(x), constructing and checking $h(x)$, and plotting the graphs one by one.
Don't worry about automatically testing this function - matplotlib behaves strangely and is very hard to test reliably.
Example Output
An example output for a more complicated function:
def f(x):
    if x<=.5:
        return (2*x)**2
    if x>.5:
        return numpy.sin(numpy.pi*x)
Returns the figure:
Graded Exercise: Upload your .py library file containing this function to Brightspace. In addition, upload a .png file with the output for a function of your choice other than the provided example. The function must be continuous and satisfy the initial conditions, and should not be identically 0, but otherwise is up to you!
Improving Efficiency Using NumPy
You can dramatically increase your efficiency by computing f(x) only once at each value, storing the result in numpy arrays, and slicing.
A very useful result for this is numpy.roll(array,n), which "rolls" an array $n$ values forward or backwards.
Say that you are trying to divide $f$ into segments for $k$ time values.
You can create the odd extension to $[0,2]$ as a numpy array, and roll it forward and backwards.
Make sure your number of segments is divisible by your time step!
This is most of what you need to create animations like:
Making Math Come Alive with Animation
This kind of picture is all well and good for a textbook, but on the web - and in student imagination - animation is king.
You can (the solution I am partial to) simply generate a bunch of image files and stitch them together. This is fast, clean, and gives you the most versatility - but requires the use of an external program such as ImageMagick. With ImageMagick convert, you can turn a bunch of pngs into a looped gif with:
convert path_to_folder/*.png -loop 0 -dispose previous animation_name.gif
Alternately, you can animate within MatPlotLib. There are many tutorials for this, but the basic concept is to create an animate(i) function that takes a frame number and changes the figure to match.
To change a line's data, you can store it at definition and edit it later:
from matplotlib import pyplot, animation
import numpy

figure, axes = pyplot.subplots()
line, = axes.plot([], [])

def init():
    line.set_data([], [])
    return line,

def animate(i):
    x = numpy.linspace(0, 2, 1000)
    y = numpy.sin(2 * numpy.pi * (x - 0.01 * i))
    line.set_data(x, y)
    return line,

anim = animation.FuncAnimation(figure, animate, init_func=init,
                               frames=200, interval=20, blit=True)

anim.save("exampleanimation.gif")
Note that this depends on an esoteric stack of installed codecs and libraries; you may have to install the codec pack ffmpeg, python library Pillow, and one or more other things. This is one reason I favor the folder-of-images approach with imagemagick.